Tales by Dots and Lines Class 8 Maths Ganita Prakash Part 2 Chapter 5 NCERT Solutions If you are searching for the Tales by Dots and Lines Class 8 Maths Ganita Prakash Part 2 Chapter 5 NCERT Solutions, you’ve come to the right place. This chapter helps students understand important mathematical concepts through easy explanations, solved examples, and step-by-step answers based on the latest NCERT syllabus.
Figure it Out (Page 113 – 116)
1. Find the mean of the following data and share your observations:
(i) The first 50 natural numbers.
(ii) The first 50 odd numbers.
(iii) The first 50 multiples of 4.
Solution:
For evenly spaced numbers, the mean equals the sum of the first and last terms divided by 2.
∴ Mean =
(i) The first 50 natural numbers are: 1, 2, 3, …, 50
Mean = = = 25.5.
(ii) The first 50 odd numbers are: 1, 3, 5, …, 99
Mean = = = 50.
(iii) The first 50 multiples of 4 are: 4, 8, 12, …, 200
Mean = = = 102.
Observations:
(i) The mean for the first n natural numbers is .
(ii) The mean for the first n odd numbers is n.
(iii) The mean of the first n multiples of 4 is 4 times the mean of the first n natural numbers.
2. The dot plot below shows a collection of data and its average, but one dot is missing. Mark the missing value so that the mean is 9 (as shown below).
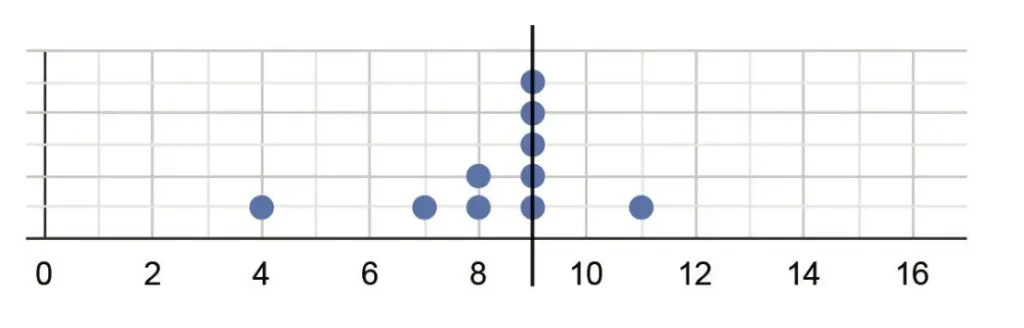
Solution:
Mean = 9
Let the missing value be x.
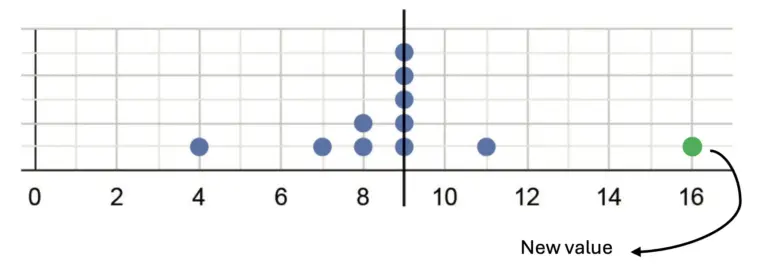
Thus, the total values are: 4, 7, 8, 8, 9, 9, 9, 9, 9, 11, x.
∴ Mean =
9 =
99 = 83 + x
x = 99 – 83
x = 16.
3. Sudhakar, the class teacher, asks Shreyas to measure the heights of all 24 students in his class and calculate the average height. Shreyas informs the teacher that the average height is 150.2 cm. Sudhakar discovers that the students were wearing uniform shoes when the measurements were taken and the shoes add 1 cm to the height.
(i) Should the teacher get all the heights measured again without the shoes to find the correct average height? Or is there a simpler way?
(ii) What is the correct average height of the class?
(a) 174.2 cm (b) 126.2 cm (c) 150.2 cm
(d) 149.2 cm (e) 151.2 cm (f ) None of the above (g) Insufficient information
Solution:
(i) No, the teacher does not need to measure all the heights again.
Since each student’s height was increased by 1 cm due to the shoes, we can simply subtract 1 cm from the average height to get the correct average height.
(ii) Correct average height = 150.2 − 1 = 149.2 cm
Therefore, the correct average height of the class is 149.2 cm.
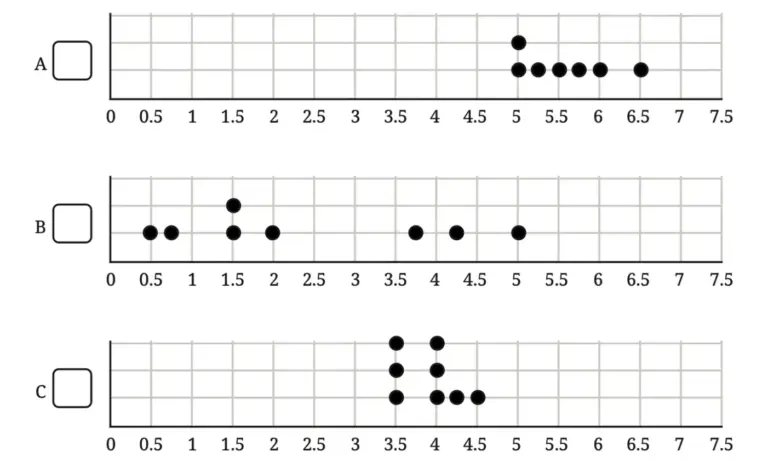
4. The three dot plots below show the lengths, in minutes, of songs of different albums. Which of these has a mean of 5.57 minutes? Explain how you arrived at the answer.
Solution:
By observing the dot plots, we see that the song lengths in Album A are mostly between 5 and 6.5 minutes, so its mean is likely to be close to 5.57 minutes. The song lengths in Albums B and C are generally smaller, so their means are less than 5.57 minutes.
Therefore, Album A has a mean of 5.57 minutes.
5. Find the median of 8, 10, 19, 23, 26, 34, 40, 41, 41, 48, 51, 55, 70, 84, 91, 92.
(i) If we include one value to the data (in the given list) without affecting the median, what could that value be?
(ii) If we include two values to the data without affecting the median what could the two values be?
(iii) If we remove one value from the data without affecting the median what could the value be?
Solution:
Given data: 8, 10, 19, 23, 26, 34, 40, 41, 41, 48, 51, 55, 70, 84, 91, 92.
Number of observations = 16
Median = Average of and terms
Median = Average of 8th and 9th terms
Median = = = 41.
(i) After including one value, there will be 17 observations. The median will be the 9th observation.
To keep the median 41, the new value can be 41.
(ii) After including two values, there will be 18 observations. The median will be the average of the 9th and 10th observations.
To keep the median 41, we need to add two numbers whose sum is 82. We can add one value less than 41 and one value greater than 41 such that their sum is 82.
(iii) After removing one value, there will be 15 observations. The median will be the 8th observation.
Since 41 occurs twice in the data, we can remove one of the 41s and the median will remain 41.
6. Examine the statements below and justify if the statement is always true, sometimes true, or never true.
(i) Removing a value less than the median will decrease the median.
(ii) Including a value less than the mean will decrease the mean.
(iii) Including any 4 values will not affect the median.
(iv) Including 4 values less than the median will increase the median.
Solution:
(i) Sometimes true.
Removing a value less than the median may change the middle position of the data and decrease the median. However, in some cases, the median may remain unchanged.
(ii) Always true.
Adding a value less than the mean lowers the average, so the mean decreases.
(iii) Sometimes true.
Adding 4 values may or may not change the middle observation(s). Therefore, the median may remain the same or change.
(iv) Never true.
Adding 4 values less than the median cannot increase the median. It may decrease the median or leave it unchanged.
7. The mean of the numbers 8, 13, 10, 4, 5, 20, y, 10 is 10.375. Find the value of y.
Solution:
Mean of 8 numbers = 10.375
Mean =
Mean =
10.375 =
10.375 × 8 = 70 + y
83 = 70 + y
y = 83 – 70
y = 13.
8. The mean of a set of data with 15 values is 134. Find the sum of the data.
Solution:
Mean of 15 values = 134
Mean =
134 =
Sum of observations = 134 × 15 = 2010.
Therefore, the sum of the data is 2010.
9. Consider the data: 12, 47, 8, 73, 18, 35, 39, 8, 29, 25, p. Which of the following number(s) could be p if the median of this data is 29?
(i) 10 (ii) 25 (iii) 40 (iv) 100 (v) 29 (vi) 47 (vii) 30
Solution:
Arranging the data in ascending order:
8, 8, 12, 18, 25, 29, 35, 39, 47, 73
Number of observations = 11(odd)
Median = term
Median = 6th term
Median = 29
Thus, p must be 29 or any value greater than 29 to keep the median 29.
Hence, the possible values of p are: 29, 30, 40, 47, 100.
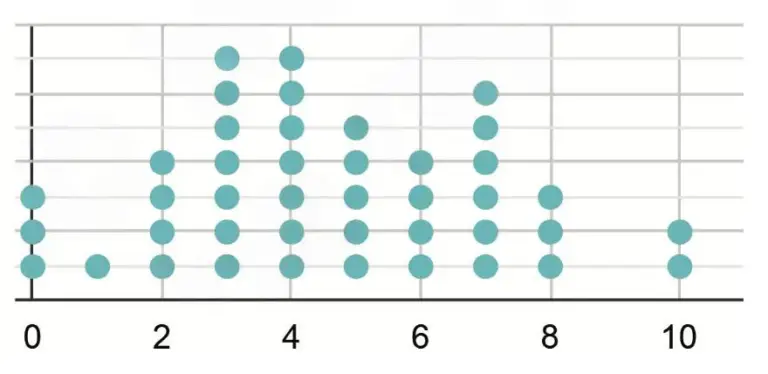
10. The number of times students rode their cycles in a week is shown in the dot plot below. Four students rode their cycles twice in that week.
(i) Find the average number of times students rode their cycles.
(ii) Find the median number of times students rode their cycles.
(iii) Which of the following statements are valid? Why?
(a) Everyone used their cycle at least once.
(b) Almost everyone used their cycle a few times.
(c) Some students cycled more than once on some days.
(d) Exactly 5 students have used their cycles more than once on some days.
(e) The following week, if all of them cycled 1 more time than they did the previous week, what would be the average and median of the next week’s data?
Solution:
From the dot plot, the frequencies are:
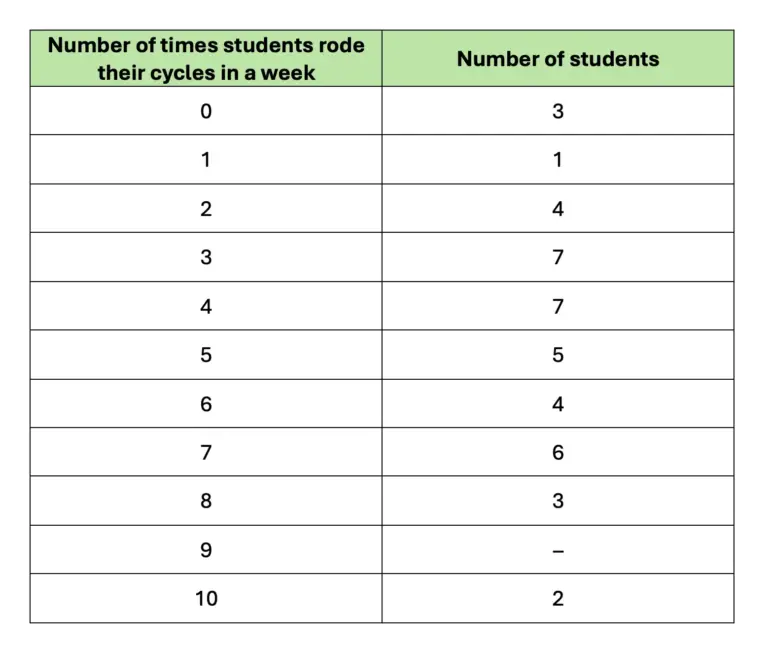
Total number of students = 3 + 1 + 4 + 7 + 7 + 5 + 4 + 6 + 3 + 2 = 42
(i) Sum of all observations = (0 × 3) + (1 × 1) + (2 × 4) + (3 × 7) + (4 × 7) + (5 × 5) + (6 × 4) + (7 × 6) + (8 × 3) + (10 × 2)
= 0 + 1 + 8 + 21 + 28 + 25 + 24 + 42 + 24 + 20 = 193
Mean = = 4.59
Therefore, the average is 4.6 times.
(ii) Number of observations = 42
Median = Average of and observations
Median = Average of 21st and 22nd observations
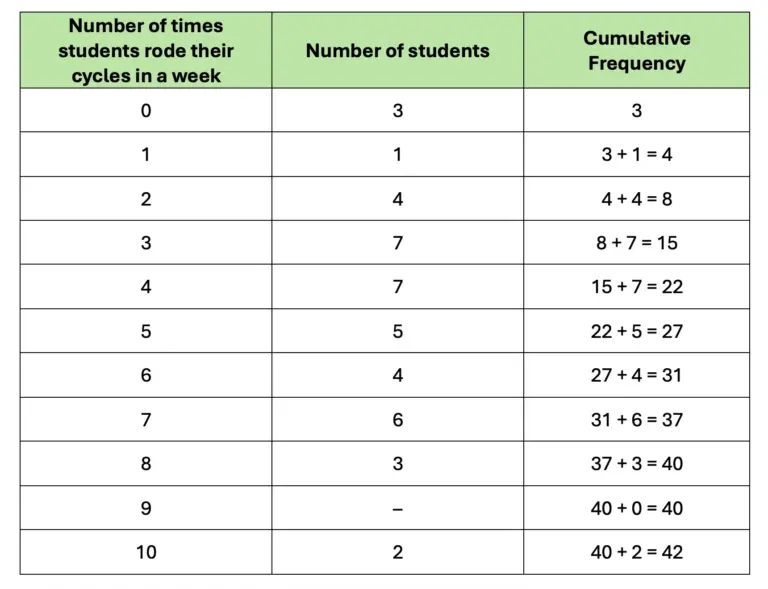
From the ordered data, both the 21st and 22nd observations are 4.
Median = = 4.
(iii)
(a) Invalid. Three students did not use their cycles at all (0 times).
(b) Valid. Most students rode their cycles between 2 and 8 times.
(c) Invalid. The data only shows the total number of times cycled in a week. It does not tell us how many times they cycled on a particular day.
(d) Invalid. The dot plot does not provide information about daily cycling.
(e) Adding 1 to every observation increases both the mean and the median by 1.
New mean = 4.59 + 1 = 5.59
New median = 4 + 1 = 5
11. A dart-throwing competition was organised in a school. The number of throws participants took to hit the bull’s eye (the centre circle) is given in the table below. Describe the data using its minimum, maximum, mean and median.


Solution:
(i) Minimum number of trials = 1
(ii) Maximum number of trials = 10
(iii) Total number of students = 1 + 0 + 0 + 1 + 4 + 9 + 12 + 15 + 10 + 10 = 62
Sum of all observations =
= (1 × 1) + (4 × 1) + (5 × 4) + (6 × 9) + (7 × 12) + (8 × 15) + (9 × 10) + (10 × 10)
= 1 + 4 + 20 + 54 + 84 + 120 + 90 + 100 = 473
Mean = = 7.63
So, the mean number of trials is 7.63.
(iv) Median = Average of and observations
Median = Average of 31st and 32nd observations
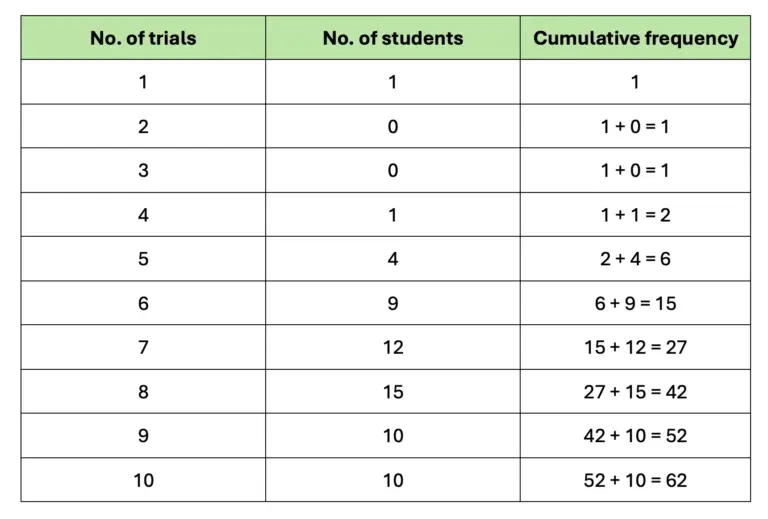
From the above data, both 31st and 32nd observations are 8.
Median = = = 8
So, the median number of trials is 8.
Figure it Out (Page 122 – 123)
1. The average number of customers visiting a shop and the average number of customers actually purchasing items over different days of the week is shown in the table below. Visualise this data on a line graph.
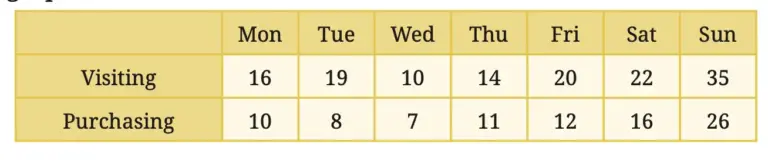
Solution:
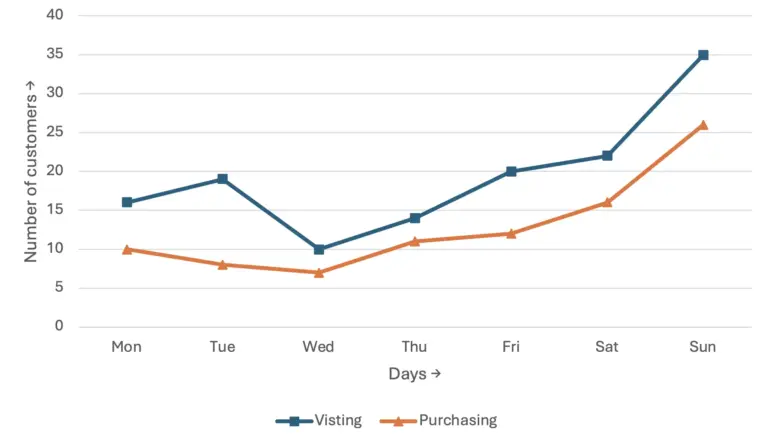
2. The average number of days of rainfall in each month for a few cities is shown in the table below:
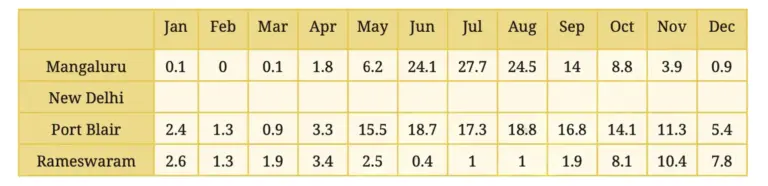
(i) What could be the possible method to compile this data?
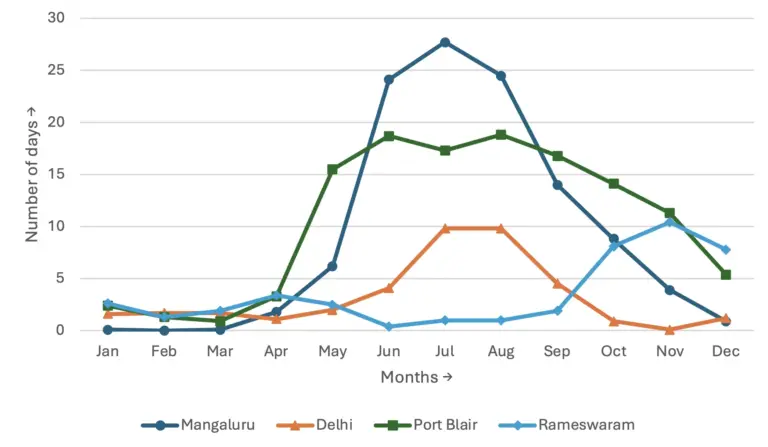
(ii) Mark the data for Mangaluru, Port Blair, and Rameswaram in the line graph shown below. You can round off the values to the nearest integer.
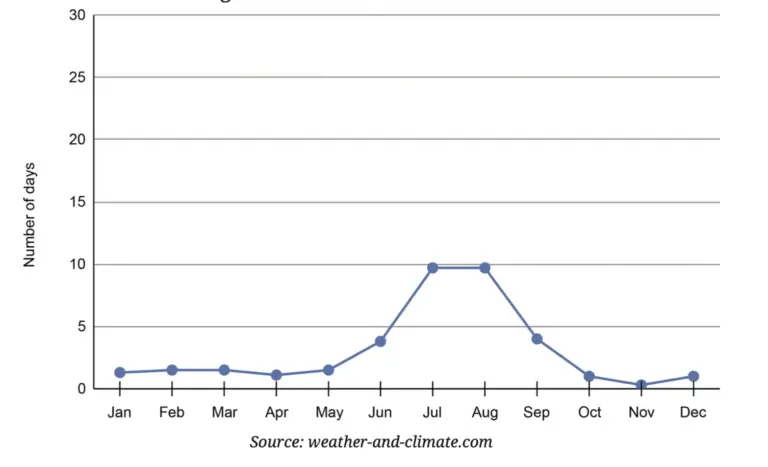
(iii) Based on the line for New Delhi in the graph, fill the data in the table.
(iv) Which city among these receives the most number of days of rainfall per year? Which city gets the least number of days of rainfall per year?
(v) Looking at the table, when is the rainy season in New Delhi and Rameswaram?
Solution:
(i) Line graph.
(ii)
(iii)
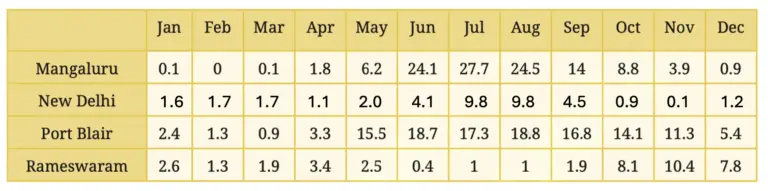
(iv) Mangaluru receives the most number of days of rainfall per year.
Rameswaram gets the least number of days of rainfall per year.
(v) The rainy season in Delhi is from June to August, and in Rameswaram, it is from October to December.
3. The following line graph shows the number of births in every month in India over a time period:
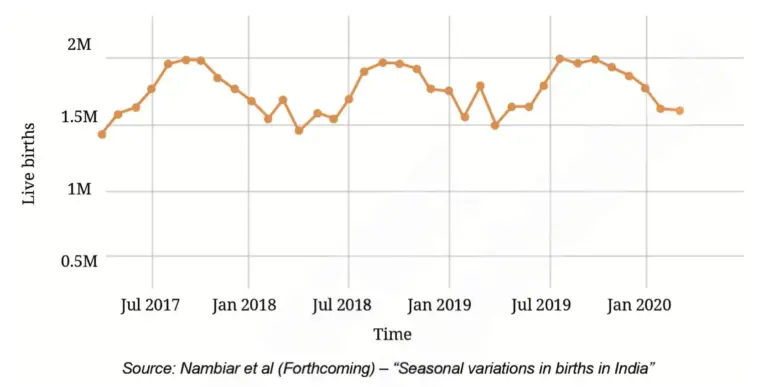
(i) What are your observations?
(ii) What was the approximate number of births in July 2017?
(iii) What time period does the graph capture?
(iv) Compare the number of births in the month of January in the years 2018, 2019, and 2020.
(v) Estimate the number of births in the year 2019.
Solution:
(i) Observations:
1. Births generally increase during the middle and later months of each year and decrease at the beginning of the year.
2. The highest number of births is close to 1.9 million per month.
3. The lowest number of births is around 1.4 million per month.
(ii) Approximately 1.8 million.
(iii) The graph captures data from approximately April 2017 to March 2020.
(iv)
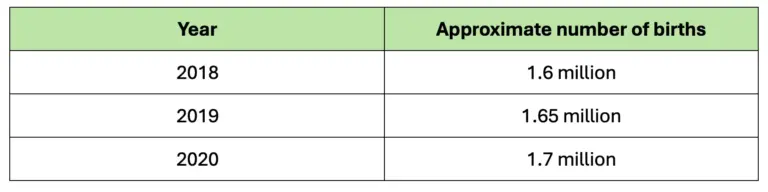
Thus, the number of births in January increased each year slightly from 2018 to 2020.
(v) The monthly births in 2019 are mostly between 1.5 million and 1.9 million, with an average of about 1.7 million births per month.
Estimated births in 2019 = 1.7 million × 12 = 20.4 million
Therefore, the estimated number of births in 2019 is about 20 million.
Figure it Out (Page 127 – 132)
1. Mean Grids:

(i) Fill the grid with 9 distinct numbers such that the average along each row, column, and diagonal is 10.
(ii) Can we fill the grid by changing a few numbers and still get 10 as the average in all directions?Solution:
(i) One possible filling is:
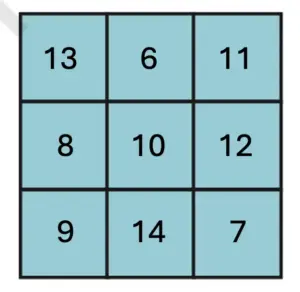
Here, the sum in each row, column, and diagonal = 30
Therefore, average = = 10.
(ii) Yes, we can change the positions of the numbers and still get an average of 10.
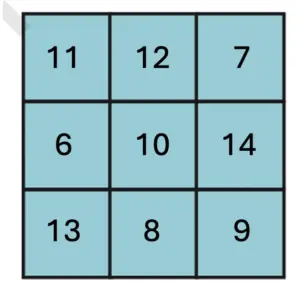
Here also, every row, column, and diagonal has a sum of 30, so the average is 10.
2. Give two examples of data that satisfy each of the following conditions:
(i) 3 numbers whose mean is 8.
(ii) 4 numbers whose median is 15.5.
(iii) 5 numbers whose mean is 13.6.
(iv) 6 numbers whose mean = median.
(v) 6 numbers whose mean > median.
Solution:
(i) Since mean = 8
Sum of numbers = 3 × 8 = 24
Examples:
• 6, 8, 10
• 5, 7, 12
(ii) For 4 numbers, the median is the average of the two middle numbers.
Examples:
• 12, 15, 16, 25
• 10, 15, 16, 20
Here in both cases, Median = = = 15.5
(iii) Since mean = 13.6
Sum of numbers = 5 × 13.6 = 68
Examples:
• 10, 12, 14, 15, 17
• 8, 12, 14, 16, 18
(iv) Examples:
• 2, 4, 6, 8, 10, 12
Mean = = 7
Median = = = 7
• 5, 7, 9, 11, 13, 15
Mean = = 10
Median = = = 10
(v) Examples:
• 1, 2, 3, 4, 5, 15
Mean = = 5
Median = = = 3.5
So, Mean > Median.
• 2, 4, 6, 8, 10, 30
Mean = = 10
Median = = = 7
So, Mean > Median.
3. Fill in the blanks such that the median of the collection is 13: 5, 21, 14,____, _____, _____. How many possibilities exist if only counting numbers are allowed?
Solution:
The numbers are: 5, 21, 14, ____, ____, ____.
Number of terms = 6
Median = 13
After arranging the numbers in ascending order,
Median = Average of and term
Median = Average of 3rd and 4th term
Median = = 13
= 13
3rd term + 4th term = 26
Thus, any arrangement of counting numbers for which the 3rd and 4th terms add up to 26 will work.
Examples:
5, 10, 13, 13, 14, 21
5, 12, 12, 14, 14, 21
5, 11, 12, 14, 14, 21
Therefore, infinitely many possibilities exist if only counting numbers are allowed.
4. Fill in the blanks such that the mean of the collection is 6.5: 3, 11, ____, _____, 15, 6. How many possibilities exist if only counting numbers are allowed?
Solution:
Let the two missing terms be a and b.
Collection = 3, 11, a, b, 15, 6
Mean = 6.5
Number of terms in collection = 6
Mean = = 6.5
3+ 11 + a + b + 15 + 6 = 6.5 × 6
35 + a + b = 39
a + b = 39 – 35
a + b = 4
Since a and b are counting numbers, the possible pairs are (1, 3), (2, 2), and (3, 1).
Therefore, there are 3 possible ways to fill the blanks.
5. Check whether each of the statements below is true. Justify your reasoning. Use algebra, if necessary, to justify.
(i) The average of two even numbers is even.
(ii) The average of any two multiples of 5 will be a multiple of 5.
(iii) The average of any 5 multiples of 5 will also be a multiple of 5.
Solution:
(i) False
Let the two even numbers be 2x and 2y.
Average = = = (x + y).
Since x + y may be odd or even, the average is not always even.
(ii) False
Let the two multiples of 5 be 5m and 5n.
Average = = .
This is a multiple of 5 only if is an integer, i.e., only when m + n is even.
(iii) True.
Let the five multiples of 5 be 5a, 5b, 5c, 5d, and 5e.
Average = =
Since a + b + c + d + e is an integer, the average is a multiple of 5.
6. There were 2 new admissions to Sudhakar’s class just a couple of days after the class average height was found to be 150.2 cm.
(i) Which of the following statements are correct? Why?
(a) The average height of the class will increase as there are 2 new values.
(b) The average height of the class will remain the same.
(c) The heights of the new students have to be measured to find out the new average height.
(d) The heights of everyone in the class has to be measured again to calculate the new average height.
Solution:
The average may increase, decrease, or remain the same depending on the heights of the new students.
Therefore,
(c) The heights of the new students have to be measured to find out the new average height is the correct statement.
(ii) The heights of the two new joinees are 149 cm and 152 cm. Which of the following statements about the class’ average height are correct? Why?
(a) The average will remain the same.
(b) The average will increase.
(c) The average will decrease.
(d) The information is not sufficient to make a claim about the average.
Solution:
Average height of the class = 150.2 cm
Average height of the new joinees = = = 150.5 cm
Since 150.5 cm > 150.2 cm, the new class’s average will increase.
Therefore,
(b) The average will increase is the correct statement.
(iii) Which of the following statements about the new class average height are correct? Why?
(a) The median will remain the same.
(b) The median will increase.
(c) The median will decrease.
(d) The information is not sufficient to make a claim about median.
Solution:
The median depends on the positions of all the heights when arranged in order. We do not know the heights of the other students in the class.
So, we cannot determine whether the median will increase, decrease, or remain the same.
Therefore
(d) The information is not sufficient to make a claim about the median is the correct statement.
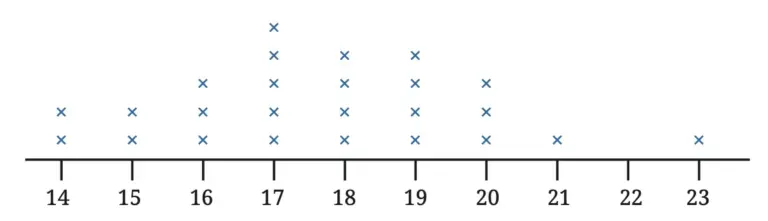
7. Is 17 the average of the data shown in the dot plot below? Share the method you used to answer this question.
Solution:
Method: Counting the frequency of each value.
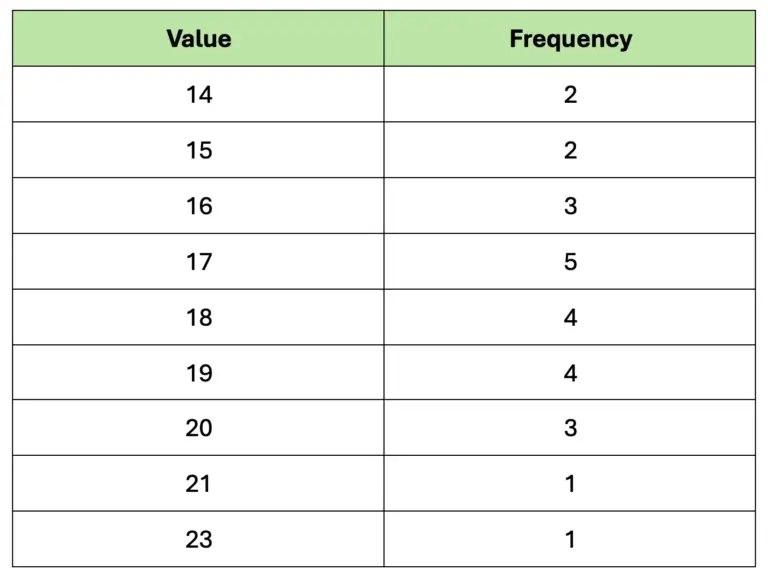
Total number of observations = 2 + 2 + 3 + 5 + 4 + 4 + 3 + 1 + 1 = 25
Sum of all observations =
= (14 × 2) + (15 × 2) + (16 × 3) + (17 × 5) + (18 × 4) + (19 × 4) + (20 × 3) + (21 × 1) + (23 × 1)
= 28 + 30 + 48 + 85 + 72 + 76 + 60 + 21 + 23 = 443
Therefore,
Average = = 17.72
Since 17.72 ≠ 17, 17 is not the average of the data.
8. The weights of people in a group were measured every month. The average weight for the previous month was 65.3 kg and the median weight was 67 kg. The data for this month showed that one person has lost 2 kg and two have gained 1 kg. What can we say about the change in mean weight and median weight this month?
Solution:
The total change in weight = (−2) + 1 + 1 = 0 kg
So, the total weight of the group remains unchanged. Therefore, the mean weight remains 65.3 kg.
For the median, we do not know which people gained or lost weight and how their weights are placed in the ordered list. Hence, we cannot determine whether the median changes or remains the same.
9. The following table shows the retail price (in ₹) of iodised salt in the month of January in a few states over 10 years. For your calculations and plotting you may round off values to the nearest counting number.
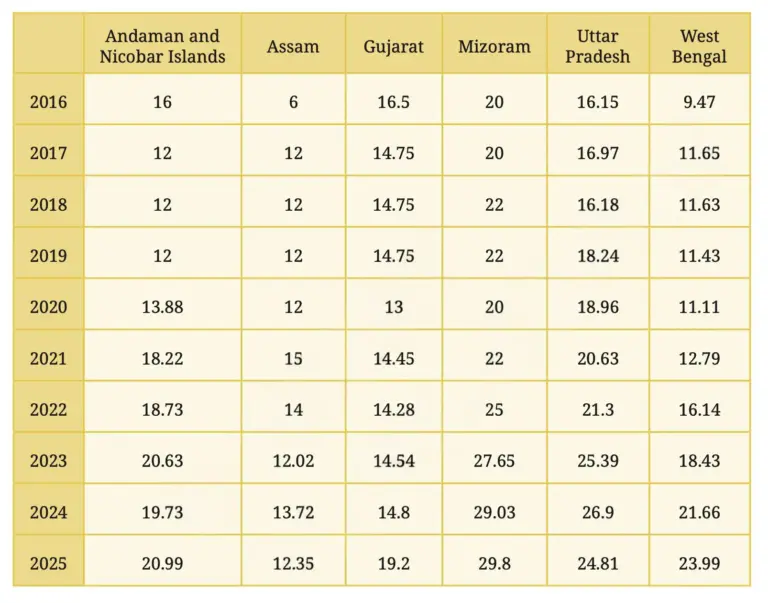
(i) Choose data from any 3 states you find interesting and present it through a line graph using an appropriate scale.
(ii) What do you find interesting in this data? Share your observations.
(iii) Compare the price variation in Gujarat and Uttar Pradesh.
(iv) In which state has the price increased the most from 2016 to 2025?(v) What are you curious to explore further?
Solution:
(i)
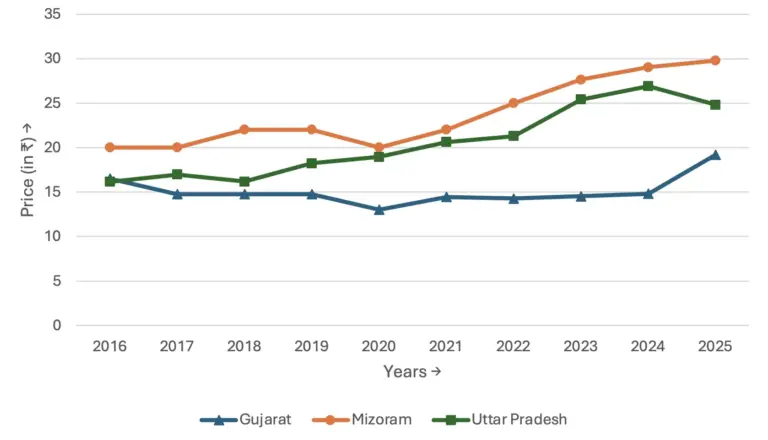
(ii) Observations:
1. The price of iodised salt has generally increased over the years.
2. Mizoram has the highest salt prices among the given states.
3. Gujarat shows the least variation in prices.
4. West Bengal and Uttar Pradesh show a significant increase in prices during the period.
(iii) The price variation is much greater in Uttar Pradesh than in Gujarat.
(iv)
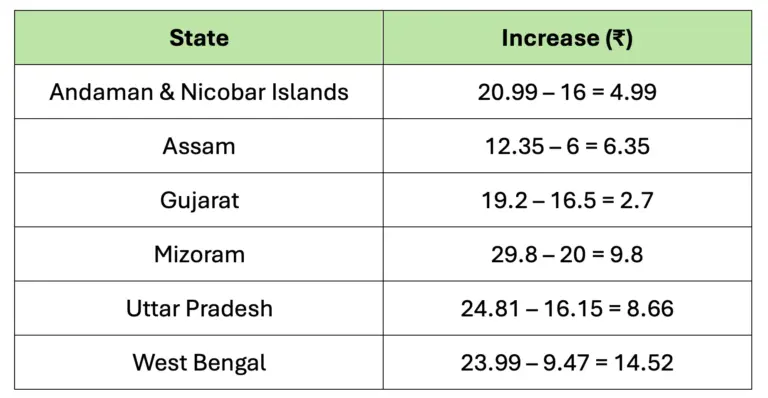
Hence, West Bengal has the highest increase in price from 2016 to 2025.
(v) I would like to explore:
Why salt prices differ from one state to another.
How transportation and production costs affect the price.
10. Referring to the graph below, which of the following statements are valid? Why?
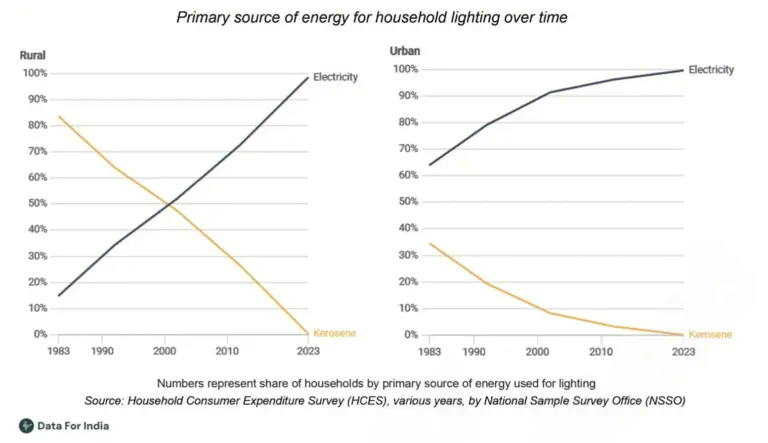
(i) In 1983, the majority in rural areas used kerosene as a primary lighting source while the majority in urban areas used electricity.
(ii) The use of kerosene as a primary lighting source has decreased over time in both rural and urban areas.
(iii) In the year 2000, 10% of the urban households used electricity as a primary lighting source.
(iv) In 2023, there were no power cuts.
Solution:
(i) Valid.
From the graph, about 83% of rural households used kerosene and about 15% used electricity. In urban areas, about 65%used electricity and about 35% used kerosene.
(ii) Valid.
The share of households using kerosene decreases continuously from 1983 to 2023 in both rural and urban areas.
(iii) Not valid.
The graph shows that in 2000, about 90% of urban households used electricity, not 10%.
(iv) Not valid.
The graph only shows the primary source of lighting used by households. It does not provide any information about power cuts or electricity supply interruptions.
11. Answer the following questions based on the line graph.
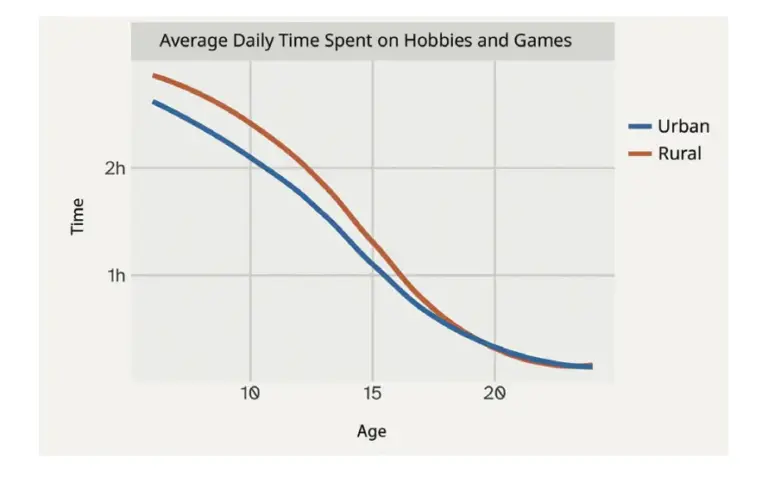
(i) How long do children aged 10 in urban areas spend each day on hobbies and games?
(ii) At what age is the average time spent daily on hobbies and games by rural kids 1.5 hours?
(a) 8 years
(b) 10 years
(c) 12 years
(d) 14 years
(e) 18 years
(iii) Are the following statements correct?
(a) The average time spent daily on hobbies and games by kids aged 15 is twice that of kids aged 10.
(b) All rural kids aged 15 spend at least 1 hour on hobbies and games every day.
Solution:
(i) A little more than 2 hours.
(ii) (d) 14 years.
(iii)
(a) Incorrect statement.
(b) Correct statement.
12. Individual project: Make your own activity strip for different days of the week.

(i) Do you eat and sleep at regular times every day? Typically how long do you spend outdoors?
(ii) Calculate the average time spent per activity. Represent this average day using a strip.
(iii) Similarly, track the activities of any adult at home. Compare your data with theirs.
Solution:
Do it yourself.
13. Small group project: Make a group of 3-4 members. Do at least one of the following:
(i) Track daily sleep time of all your family members for a week. Daily sleep time includes nighttime sleep, naps, and any sleep during the day.
(a) Represent this on strips.
(b) Put together the data of all your group members. Calculate the average and median sleep time of children, adults, elderly.
(c) Share your findings and observations.
(ii) When do schools start and end? On a weekday, Manoj’s school starts at 9:30 am and ends at 4:30 pm, i.e., 7 hours, which includes class time and breaks. Collect information on the daily timings of different schools for Grade 8, including. class time and break time (the schools can be anywhere in the country. You can ask your neighbours, relatives, parents and friends to find out). Analyse and present the data collected.
Solution:
Do it yourself.
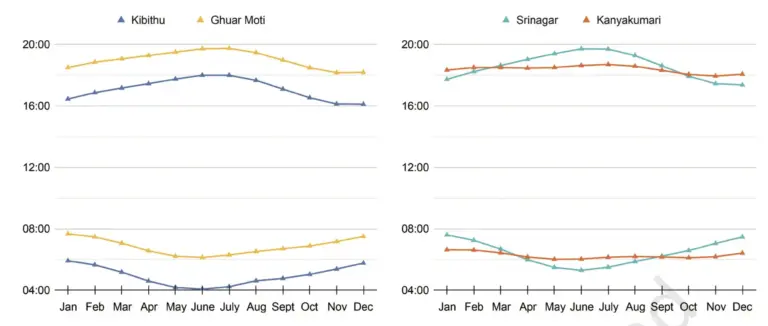
14. The following graphs show the sunrise and sunset times across the year at 4 locations in India. Observe how the graphs are organised. Are you able to identify which lines indicate the sunrise and which indicate the sunset?
Answer the following questions based on the graphs:
(i) At which place does the sun rise the earliest in January? What is the approximate day length at this place in January?
(ii) Which place has the longest day length over the year?
(iii) Share your observations — what do you find interesting? What are you curious to find out?
Solution:
(i) The sun rises earliest in Kibithu in January (about 6:00 a.m.).
Approximate day length at Kibithu in January = 4:30 p.m. − 6:00 a.m.
= 10 hours 30 minutes
(ii) Srinagar has the longest day length over the year.
In June,
Sunrise ≈ 5:00 a.m.
Sunset ≈ 7:45 p.m.
Therefore, Day length ≈ 14 hours 45 minutes.
(iii) Observations:
1. Srinagar has the greatest variation in day length during the year.
2. Kanyakumari has the least variation in day length.
3. Kibithu experiences sunrise earlier than the other places.
4. Day length is longer in summer and shorter in winter.
Interesting: Day lengths are different at different places in India.
Curious to know: Why do sunrise and sunset times change with seasons and location?
15. We all know the typical sunrise and sunset timings. Do you know when the moon rises and sets? Does it follow a regular pattern like the sun? Let’s find out. The following graph shows the moonrise and moonset time over a month:
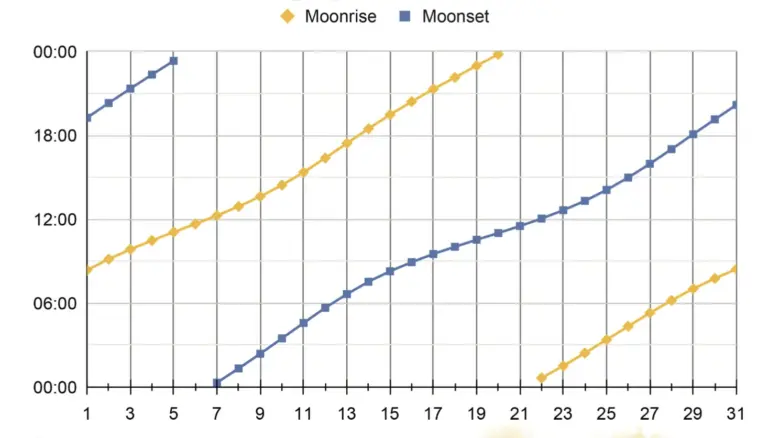
(i) Find out on what dates amavasya (new moon) and purnima (full moon) were in this month.
(ii) What do you notice? What do you wonder?
Solution:
(i) Purnima: 7th day
Amavasya: 21st day
(ii) Observation:
The moonrise and moonset times change every day.
The Moon rises and sets later each day.
There are about 14 days between purnima and amavasya.
I Wonder:
Why does the moonrise time change every day?
Why are the moonrise and moonset patterns different from those of the Sun?
Our solutions are written in simple language, making them helpful for homework, exam preparation, and quick revision. Every answer is explained clearly so that students can understand the concepts instead of just memorizing them.
👉 Read the complete NCERT Solutions here: https://schoollearners.in/
At schoollearners.in/, you can also find:
Study Materials for Classes 6–12
Chapter-wise NCERT Solutions
Important Questions with Answers
MCQs and Practice Worksheets
Revision Notes
Previous Year Questions